The Algorithm that finds the ‘Best’ Portfolio
Published 5 February 2021
By Dr Peter J Phillips, Associate Professor (Finance & Banking) University of Southern Queensland


How can you find the best portfolios, the ones that give you the highest average return at every level of risk? In this post, we continue our discussion of Markowitz’ critical line algorithm. We can’t get into technical details (rest assured you can do this with a spreadsheet program or, if you have a lot of time, by hand) but we can describe what the algorithm does and why it works.
For Markowitz, the most important characteristics of every investment are its reward (measured by its average or mean return) and its risk (measured by its variance). Measuring the average return and the variance of returns for an individual asset, say a share in Microsoft, is straightforward. Calculating the average return for a portfolio of shares, say shares in Microsoft, IBM, Dupont, and Apple, is also straightforward. If each share makes up 25 percent of the portfolio, we multiply each share’s average return by 0.25 and sum them up to get the (weighted) average return for the portfolio.
"Imperfect covariance is the reason why diversification is a smart thing to do."
Calculating the risk or variance for a portfolio is not as easy. We might think that the variance for the portfolio is also the weighted average of the variances of each share. However, this is only a part of the story. We also must account for something called covariance. That is, the degree to which the returns on each share move up and down together.
Imperfect covariance is the reason why diversification is a smart thing to do. The returns on different shares do not all move in lockstep with each other. Rather, some returns go up and down together while others move in opposite directions, going up when others go down. If you invest only in shares in retail companies, you expect the returns on each share to move in the same direction most of the time. Good or bad retail conditions affect the companies in the same way.
If you invest in shares in retail companies and mining companies, good or bad retail conditions may not always correspond with good or bad mining conditions. Your retail shares might go up when the mining shares go down and vice versa. The portfolio’s variance, however, might be quite stable because the ups and downs dampen each other out. This is the secret to diversification. It is because of imperfect covariance that you can build a portfolio that has a lower variance than any of the individual shares that are in it!
Markowitz explained how these statistics (average, variance, and covariance) form a structure that holds the financial markets together. If you have a portfolio, it will have a variance that is commensurate with its average return. Higher returns, higher risk. The question is, can we see this structure? What does it look like?
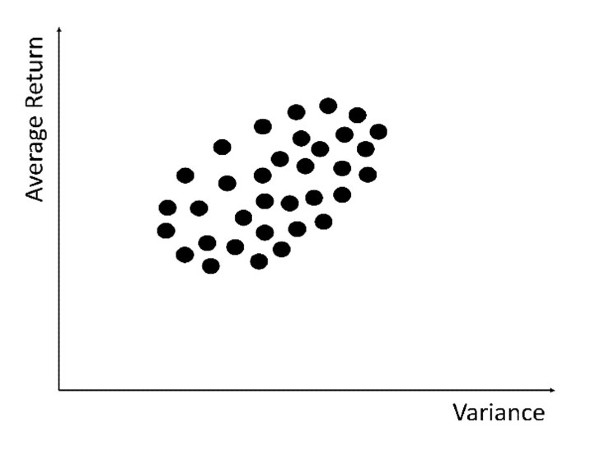
To see it, what we do is begin forming portfolios. It doesn’t matter what shares we put in them. One portfolio could be 100 percent invested in Telstra shares. Another portfolio might be 1/200th invested in each of the ASX200 companies. We build a portfolio, work out its average and its variance (considering the covariance) and plot it on a graph. We keep doing this repeatedly. After a while, will see a shape start to form. It is an ellipse, stretching upwards from left to right (of course, because more reward, more risk):
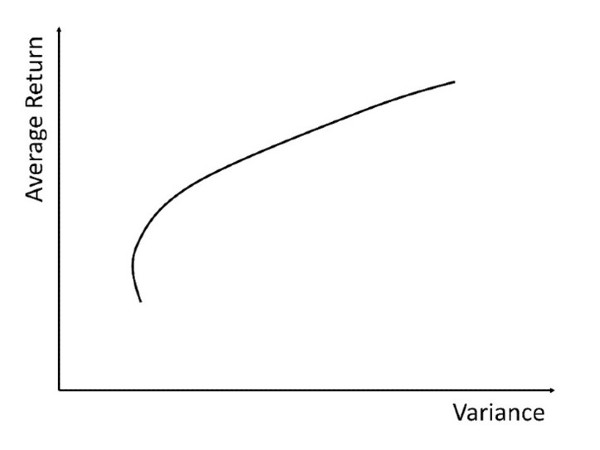
Markowitz realised that investors would only be interested in portfolios along the top edge of this shape. This top edge is called the ‘efficient set’ of portfolios. Its beautiful concave shape is another piece of the hidden structure of the financial markets:
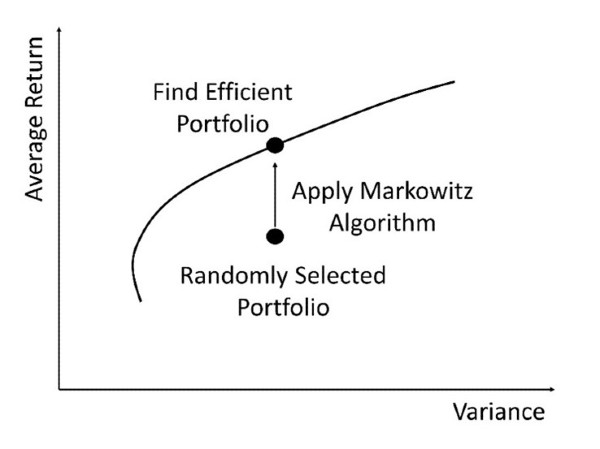
How can we find just the portfolios in the efficient set without calculating the return and variance for every single portfolio first? This is what Markowitz’ algorithm does. We can choose a random portfolio. It will have a return and a variance. We are interested in the portfolio that has the highest return at that level of variance. The Markowitz algorithm tells us how to adjust the proportion invested in each share such that the portfolio has the highest average return at that level of risk. This can be illustrated as follows:
People who believe that the financial markets have at least some sort of underlying structure will approach decisions about their investments with a different mindset than those who believe that the markets are completely random and structureless. Glimpsing the structure is a big step into a different world. Being able to run the calculations or run the algorithm is one thing. Understanding why the calculations can be run at all is possibly even more important.
Discussion Question
Do you feel that people generally believe that the financial markets are unstructured or structured? How does this affect their decision-making?
Further Reading
Chapter 6 of the textbook addresses investment strategies, including passive and active approaches. The risks that investors bear and the returns that they expect both derive from the risk-reward trade-off that characterises the market. How investors deal with this trade-off, including recognising it, will be critical to determining how they approach their investment strategy.
Read other posts
Financial Literacy: The Road Out of Financial Anxiety
Supply and Demand: The Case of the Australian Dollar
The Sad and Sorry Tale of AMP Limited
People Are Afraid to Let Their Winners Run
Finding Warren Buffet & a Cool Head in a Crisis
Self-Managed Superannuation Funds: Cash Kings?
From Zero to $100 Billion in Sixty Seconds
Simple Maths, Long Term Damage
Are Share Prices Too Volatile?
If My Super Fund Performed Poorly, I’d Change… But I Don’t Remember It Performing Poorly
My Portfolio Might Be Up 10%, But that's A Loss!
Free Cash Flow: The Driver of Shareholder Value
Australia’s New Tech Index: A Local Version of the NASDAQ?
The Behavioural Economics of ‘Going on Tilt’
A Cup of Coffee and an Option Pricing Model
Yes Virginia, there is a Mortgage Tipping Point
How Universities Shape the Real World: The Case of Corporate Finance
Disinformation: Can is Sweep Investors off their Feet?
Hedge Funds, Satellites and Empty Carparks
The Battle for FinTech Supremacy: The Tech Titans Vs the Masters of the Universe