

My Wish List
Business Statistics
Featured Business Statistics & Analytics Resources
Coming soon...
Prepare your students to excel in data-driven business environments with our 2026 release, Data Visualization: Storytelling with Impact. Developed by experts in accounting, business analytics, and IT, this resource empowers students to interpret and communicate data effectively while fostering broader career relevance.
- AMPS Framework: Guides students through asking the right questions, mastering data, performing analysis, and sharing impactful stories.
- Ethical Practices: A dedicated chapter and integrated discussions ensure students approach data visualisation responsibly.
- Storytelling Focus: Helps students transform analysis into actionable insights that drive real-world business decisions.
- Technical Agility: Prepares students to apply visualisation principles across platforms (Excel, Tableau, Power BI) and critical thinking skills to make informed business decisions, adapting to evolving industry demands.


Richardson, Data Visualization


Richardson, Introduction to Business Analytics 2026 Release


Jaggia/Kelly, Essentials of Business Statistics 2026 Release

Jaggia, Business Analytics, 2025 Release


Lind, Statistical Techniques in Business & Economics
Digital Tools for Business Statistics and Analytics
We understand the importance of preparing students for their future careers. Building critical thinking skills alongside practical skills in tools including Excel, Tableau and Power BI are essential for students to be successful in securing a job after they graduate. That’s where Connect comes in. Paired with adaptive versions of our leading texts in Business Statistics and Analytics, Connect offers a suite of online career readiness resources focused on developing these skills among your students.
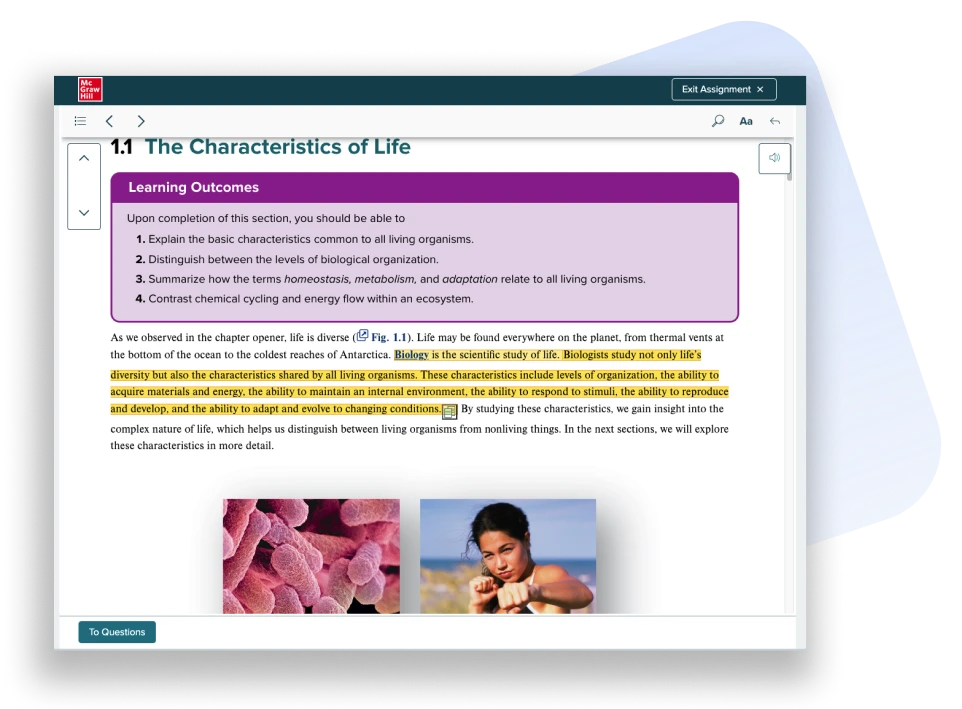
SmartBook
SmartBook is an adaptive learning experience that helps students study more effectively by assessing their comprehension of the material and guiding them to resources until they understand. SmartBook is proven to help raise students grades and encourages mastery and long-term retention. Robust reporting features enable you to track student progress and help guide teaching strategies for a more dynamic class experience.
Software & Programming Coverage
McGraw Hill’s software and programming language coverage in our Business Statistics & Analytics titles is vast, including Excel, Power BI, Tableau, Python, R, Minitab, MegaStat, and more! This includes end-of-chapter exercises and labs with assessments to help students gain practical experience applying knowledge in a variety of formats.
Business Stats Prep Courses
Prep Courses cover basic concepts in Math, Statistics, and Excel, and are comprised of animated tutorial modules with quiz questions. They create a level playing field, refreshing or filling in the gaps in students’ knowledge of important pre-requisite skills, giving you more time in class to cover new topics.
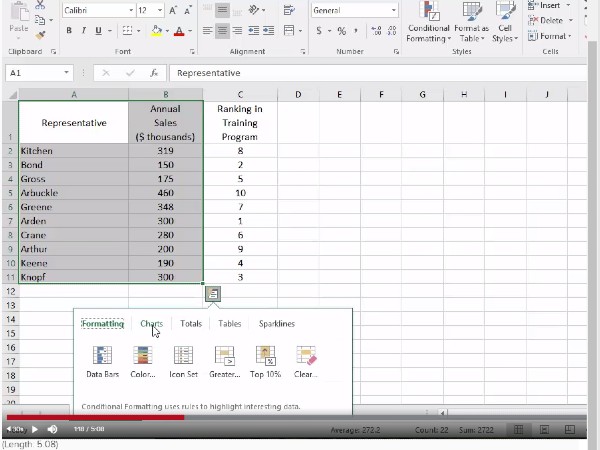
Integrated Excel Activities
The power of Microsoft Excel meets the power of McGraw Hill Connect in our all-new integration of Excel in Connect. With Integrated Excel, Excel now opens seamlessly inside Connect with no need for uploading or downloading any additional files or software. Instructors choose their auto-grading solution, either grading for formula accuracy or for the solution value.

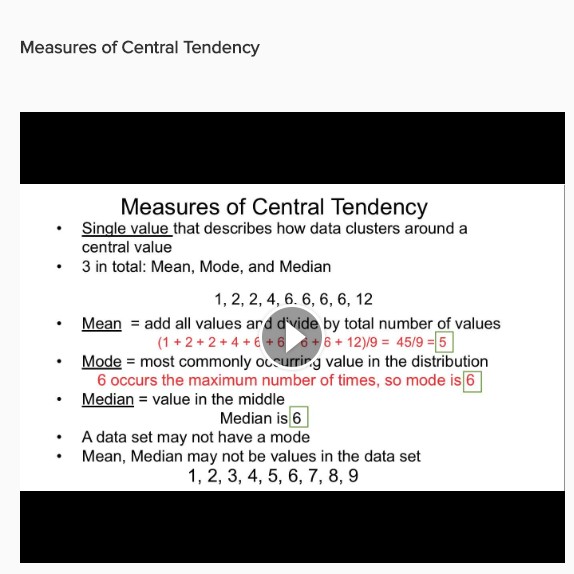
Excel Tutorial Videos
Excel tutorial videos are professionally developed videos that help students visualise and interpret standard statistical analysis techniques. They include narrated step-by-step explanations of each function using various data sets.
Algorithmic & Static Exercises
Algorithmic exercises are auto-graded exercises using different numeric values each time a problem is given to the student. This allows students to practice working a problem several times (i.e. same question, but different numbers each time). It also deters cheating because each student receives a slightly different version of the problem and correct answer. Static versions are available too, so you can have a set of exercises where students would get the same numbers.
Interactive Data Problems
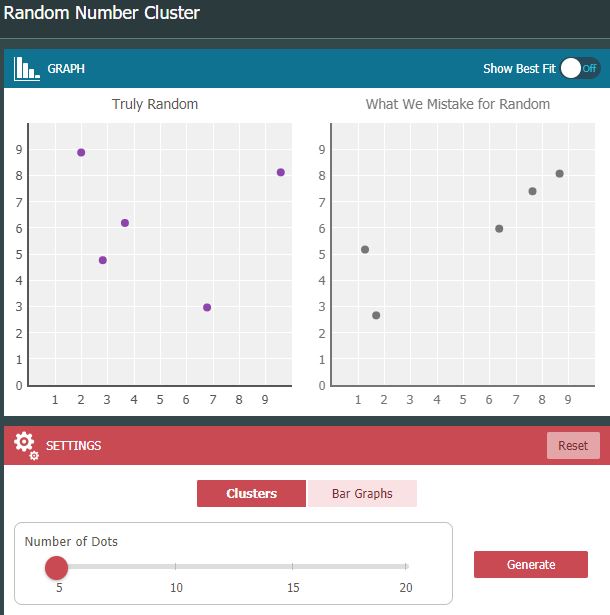
Interactive data problems allow students to visualise and interact with data in different ways. Students use the interactive tools to manipulate data and answer accompanying questions that test multiple levels of understanding.

Contact your Education Consultant to request a demo: