Products by Subdiscipline
Analytics Across the Business Curriculum
Available within McGraw Hill Connect are integrated analytics tools designed to give students relevant exposure and practice with analytics.
Dedicated analytics content and assignable material is available in the following subject areas:
- Business Analytics & Business Statistics
- Accounting
- Finance
- Marketing
- Management Information Systems
- Operations Management
- Supply Chain Management
Hands-on data analytics tools provide students with real-world practice using a variety of software used in industry, including but not limited to:
- Statistical Software Tools (R, Excel add-ons)
- Programming Tools (Python, SQLite)
- Data Visualization Tools (Tableau, Power BI)
- Data Cleaning and Preparation Tools (Alteryx, Tableau Prep)
- Marketing Tools (Google Analytics, RapidMiner)
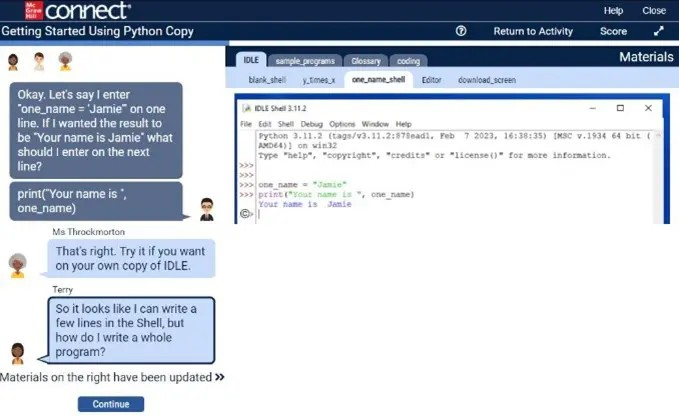
Programming Prep
Programming Prep assignments introduce students to fundamental coding and analytics techniques using two of the most widely used tools in business—Excel and Python. With adaptive technology personalising each student’s experience, these interactive activities provide targeted coaching and helpful resources as they work through questions. This low-pressure approach helps students build the confidence to tackle more advanced programming and analytics concepts.
Available in:
- Business Analytics
- Business Statistics
- Computing & Information Technology
- Management Science
- Management Information Systems
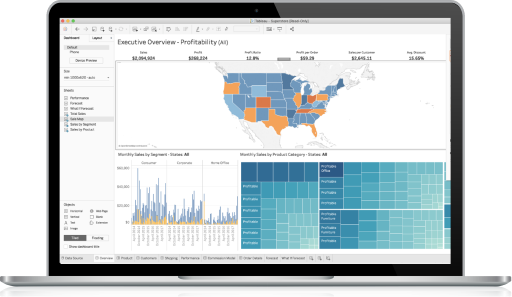
Tableau Dashboard Activities
Tableau Dashboard Activities let students explore live Tableau dashboards within McGraw Hill Connect® using interactive filters, menus, and auto-graded calculation and analysis questions. These activities help students check their understanding and apply their learning through analytics and critical thinking.
Available in: Accounting and Finance

Applying Tableau & Applying Power BI
Applying Tableau and Power BI activities help students make better business decisions by analysing data for insights. Students can create their own reports and dashboards, using data to craft compelling business stories. Students then tackle critical-thinking and calculation questions that require data manipulation and interpretation.
Available in: Accounting
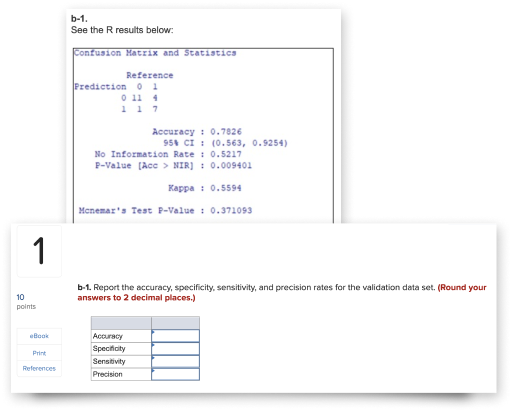
R software
McGraw Hill’s Business Analytics content gives students the chance to practice analytics in R through an easy-to-use format in Connect. Focusing on basic R functions and libraries for statistical analysis, the content emphasizes statistical thinking and communication, while providing the essential commands to help students gain exposure to this key business tool.
Available for: Business Analytics
Featured Analytics Offerings

Hair, Essentials of Marketing Analytics, 2e

Jaggia, Business Analytics, 2e


Richardson, Data Analytics for Accounting, 3e

Richardson, Introduction to Business Analytics

Contact your Education Consultant to request a demo: