Housing: Where is the Money Coming From?
Most people don’t own their houses mortgage free. Only about 28% of Australians are in that position. And this percentage has steadily fallen over the past three or four decades. Yet, anyone who watches the real estate market can see that someone is buying and the prices keep going up. Now, hardly anyone has a million dollars or more in the bank. Not many people are simply cutting cheques to buy a $1.5 million house. If most people were mortgage free or had a million dollars cash, there wouldn’t be as much concern about housing prices and mortgage rates. So, where is the money coming from?
The answer is that banks have created it by extending their balance sheets. We know that banks take deposits and make loans. We imagine that these deposits are the source of the funds for housing loans. This makes logical sense. A deposit is a bank’s liability. A loan is a bank’s asset. Assets must equal liabilities. While true in part, the money for housing loans doesn’t come from savings deposited in banks. Rather, the money is created by the banks. They initiate a loan (an asset) and credit the borrower’s bank account with the loan amount (a liability). The borrower then uses the newly created money to buy a house. The bank’s balance sheet lengthens in the process. If the savers’ deposits were the source of funds, however, the bank’s balance sheet would not lengthen.
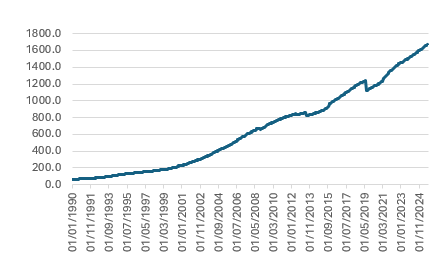
The next question, then, concerns how much credit has been provided. How much money has been created in this way? In 1990, credit extended to owner-occupiers was $64 billion. By the end of the 1990s, it was $197 billion, a 200% increase across the decade. By the end of 2009, it was $734 billion, another 270% increase for the 2000s. By the end of 2019, it was $1.151 trillion. At least the growth in 2010s was a more modest 56%! Alas, that was a brief respite. At the end of September 2025, only halfway through the decade, the credit extended to owner-occupiers was $1.675 trillion, 45% up since 2020. The graph below summarises the situation since 1990 (in $ billion):
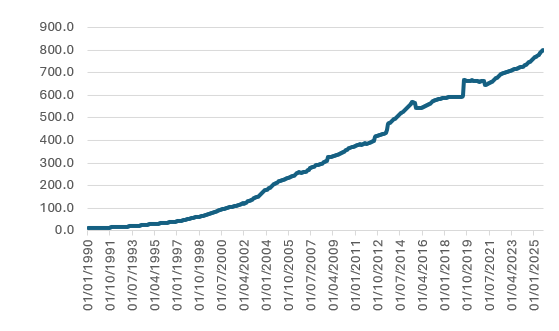
As dramatic as this might seem, it’s only part of the picture. We have only been discussing owner-occupied credit. What about credit extended to people buying investment properties? The story is much the same. Extraordinary growth. In 1990, credit extended to housing investors was $10 billion. It is now $800 billion. The graph summarises the situation ($ billion, since 1990):
All in, therefore, credit extended for housing has grown from $75 billion to around $2.5 trillion. That’s $2,500,000,000,000. That’s 3,233%. Remember, this is mostly created money. There are no savings to match. In fact, one might like to work out if it’s possible, even in theory, for Australians to pay back all this money. I suspect it might be close to impossible. Which also means that there’s not a very real foundation to the housing market. If the banks suddenly cut back either by choice or circumstance, the whole housing market is at risk. And we’ve only looked at credit for housing. There’s credit created for all sorts of other things.
The fact that house prices have continued to grow, even in the face of rising interest rates, seems to have surprised a lot of commentators. But this was inevitable. As we have explained in previous blog posts, the nominal house price growth can be explained by money supply growth and the inflation it causes. Interest rates increased in 2022 and 2023 but the real rate of interest (i.e., the interest rate minus the inflation rate) barely turned positive, even if we use the official inflation data. In real terms, mortgage rates remained far too low and, as we have seen, credit creation was far too loose.
For decades, the value of the dollar has been going down, which is to the disadvantage of wage earners. Those who owned assets saw their wealth in nominal terms explode, though in reality it is better to think of it in terms of their real wealth having been insulated rather than increased. In real terms the story is darker. At the turn of the century, it took 1,000 ounces of gold to buy a house in Australia. Now it takes only 150 ounces. In “hard” money, Australian house prices have gone down in value. Shouldn’t it be easier to buy a house then? No, because the hard money value of wages has gone down too. At the turn of the century, the average Australian wage was around 116 ounces of gold per year ($35,000 in nominal terms). In 2025 the average annual Australian wage was 17 ounces of gold ($104,000 in nominal terms… or $88,000 if we use the median). This explains why nominal house prices continue to rise, further out of reach for most nominal wage earners.
Discussion Question
Is the rate of housing credit growth sustainable? What happens if growth slows, stops, or goes backwards?
Read more Ideas in Finance
Young Investors Seeking Dividends
The Velocity of Money and Central Bank Digital Currencies
Should You Want Interest Rates to Fall?
What’s Going on with the Chinese Economy?
Is it Negative Gearing or Monetised Housing?
Set the Interest Rate at Zero. Why Not?
The Commodity Research Bureau (CRB) Index and Australian Inflation
The Disagreement between Elon Musk and Donald Trump: The Simplest Explanation?