Ideas in Finance: Update: ESG, the Reserve Bank, and Inflation
In this post, we take the opportunity to re-examine two things that have been subjects of this blog over the past few years. The first is ESG (environmental, social, governance) investing. The second is the RBA’s balance sheet, which we mentioned several times in relation to interest rates and inflation. There have been fairly big changes in both, and so it’s time to take another look.
Back in October 2021, we covered the (then) exploding growth in ESG investing. Looking back, we can see that ESG investing measured by fund flows reached its peak in 2022. There has been a dramatic slowdown since. According to Marc Jocum, writing for GlobalX ETFs, one in five dollars invested in 2022 in exchange traded funds (ETFs) in Australia went towards ESG. Now that is one in twenty dollars. While still positive in terms of inflows in Australia, in the United States there were net fund outflows in 2023 leading to a sharp rise in the number of ESG funds closing last year and a sharp drop in the number of new funds being launched. According to Reuters, $68 billion flowed into ESG funds in 2023, down from $158 billion in 2022 and $558 billion in 2021.
The overall change in mood is reflected in one part of the ESG market: Hydrogen. In July 2024, JP Morgan brokered the sale of almost $2 billion in Fortescue Metals shares amid doubts over the future of Fortescue’s foray into the green hydrogen market. More broadly, the hydrogen industry ETF managed by Global X has lost 52% of its value since its 2021 launch, mirroring similar falls in related stocks and funds. In fact, one analyst (Robert Jenkins from Lipper) told CNN: “…the ESG concept doesn’t work and that going forward, he’ll be abandoning the concept and its measurements altogether”. Jenkins told CNN that scepticism had been growing in America during 2021 and that the Ukraine war led investors to take another look at energy and energy supplies. The result was a change of sentiment towards ESG. This came on top of suspicions that so-called “ESG scores” were not accurate reflections of a company’s ESG credentials. For now, the enthusiasm of 2021 seems like a distant memory.
On our second topic, the RBA has been in the news constantly since it began raising rates in response to high inflation back in 2022. The RBA, like many central banks, introduced an inflation target in the 1990s to replace other types of rules (e.g., money supply growth rules). Since then, the RBA has been happy with inflation of, say, 2.50% p.a. Most people don’t realise that even if this target is achieved, the value of $1 will fall to less than 40 cents over 40 years. Wage earners fair worst under these circumstances unless they can do something to protect their wealth. The most common idea is to buy a house. Of course, a house also comes with a substantial liability attached (i.e., a mortgage + upkeep). If interest rates rise, the liability side of homeownership comes to outweigh the asset side for many people. This is made worse if upkeep and other housing related expenses also rise due to inflation.
Several things can contribute to inflation. High energy prices flow into the cost of everything. So do regulatory and compliance costs. So does excess money supply released during periods of artificially low interest rates.
Since 2008, interest rates have been held at an artificially low level. To keep them there, the money supply faucet was kept open. During the 2010s, a relatively strong Australian dollar and cheap imports acted as a buffer against inflation, even though interest rates were low, and the money supply was expanding. There is an obvious change in money supply growth (M3) after the 2007-2008 financial crisis, and again during the pandemic:
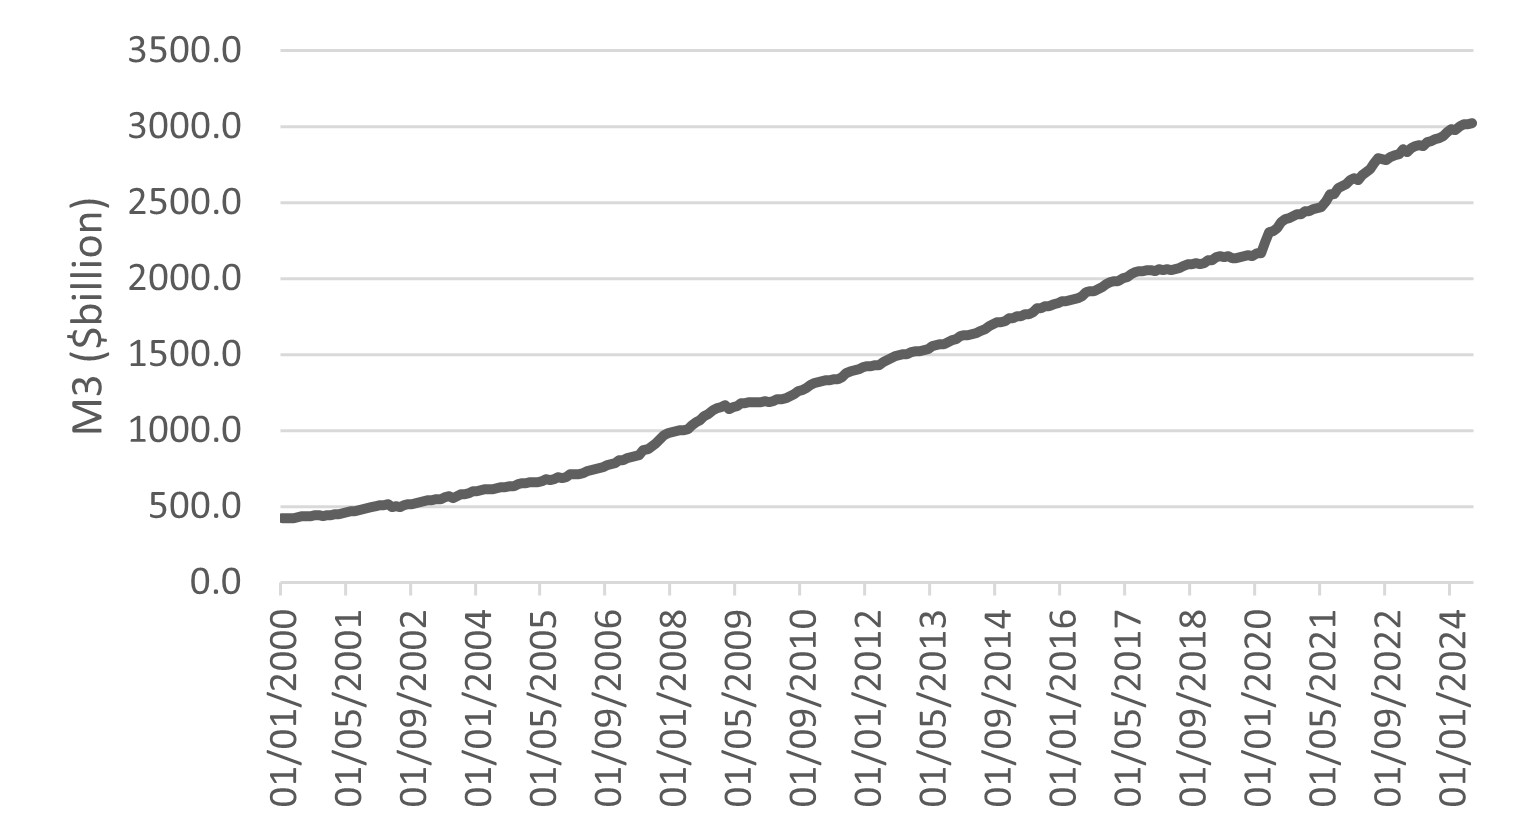
The monthly growth rate in M3 has been negative (slightly) in only 31 of 282 months in the 21st century. There were 15 such months during the 2010s. These came mostly in 2017-2019 and, if you can remember, resulted in some worrying softness in the economy and the housing market. Importantly, this attempt at winding in some of the money that had been put into the economy after the financial crisis was not associated with a change in the RBA’s target cash rate. All the bank tried to do was pull back some of the cash. Other central banks tried to do the same. The jitters that resulted caused them to pause and, before they knew it, the pandemic was in full swing and money supply was headed quickly in the other direction.
If you look at asset prices across the West during the 2010s, you see that 2014 or thereabouts is when a lot of stocks started to take off. I was reading an investment book from 2006 and the author highlights how flat Microsoft stock really had been, despite a lot of hype. After 2014, though, it took off. Along with most asset classes, including crypto and gold. This is where a lot of the money was going. Asset price inflation. However, consumer prices have been rising every year of the 21st century. Here is the inflation rate since 2000. Notice that most of the time the inflation rate has been in the target range of 2-3 percent. As a result of this “acceptable” level of inflation, the value of $1 has almost halved since 2000. If you bought a house for $400,000 in 1999 and it’s currently valued at $1,000,000, your nominal gain has been 150%. However, your real gain (how many real things your money can buy) has increased by only 33%.
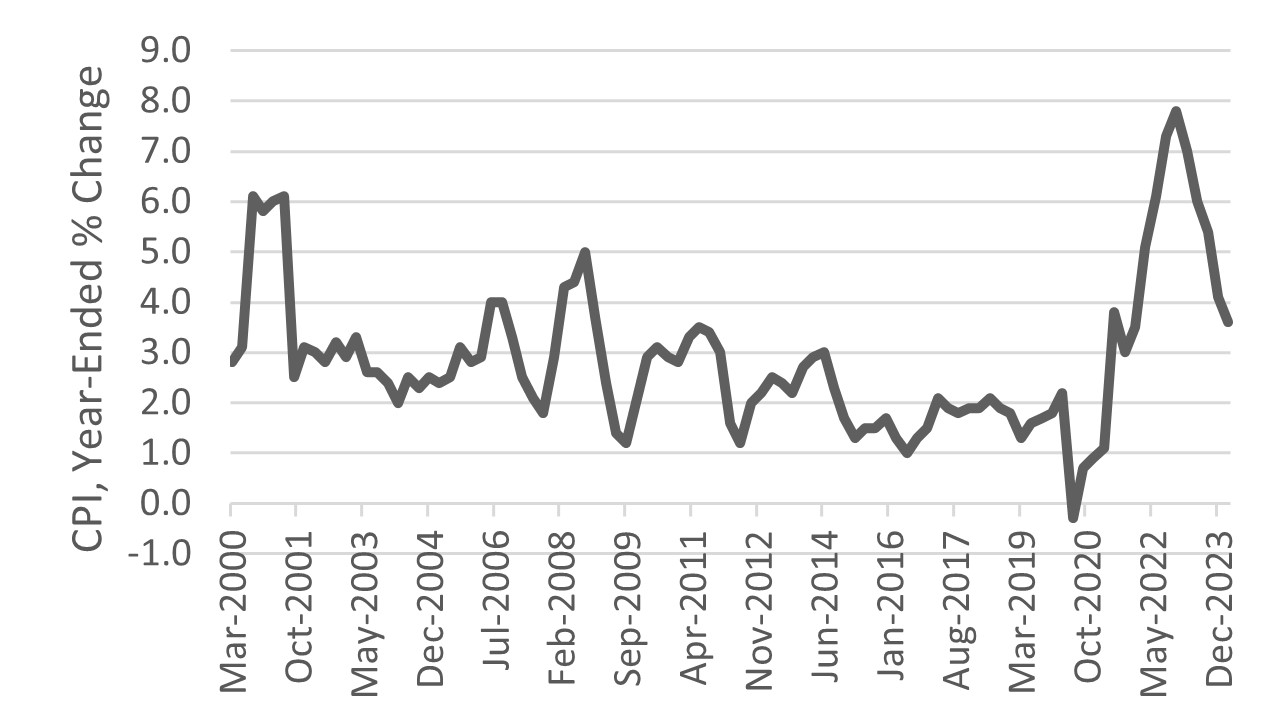
By 2022, the inflation that many people had been warning about since 2010 arrived with full force. Consumer goods prices in the West have increased by at least 20 percent since 2021. Once that happened, the central banks were forced to act. However, just like the 2017-2019 period, when money supply was pulled back a little even without a change in the target cash rate, you must look beyond the interest rate decisions if you’re looking to see just how effective the central banks will be in containing inflation. And what will they have been able to muster for the task at hand.
One place to look is the money supply data. You can see from the chart above that there has not been significant curtailment in M3 growth. Since 2022, M3 has grown by 13.72 percent. In the 30 months since January 2022, M3 growth has been negative only 6 times. Another place to look for an indication of what’s happening “behind the scenes” is the RBA’s balance sheet. In the chart below, we can see how the RBA’s assets exploded during the pandemic as it purchased government securities, transferring hundreds of billions of dollars in newly printed cash to the government to fund the lockdowns etc. It was this cash that made its way into consumer goods and financial assets and housing, and which places us in a difficult position now several years later:
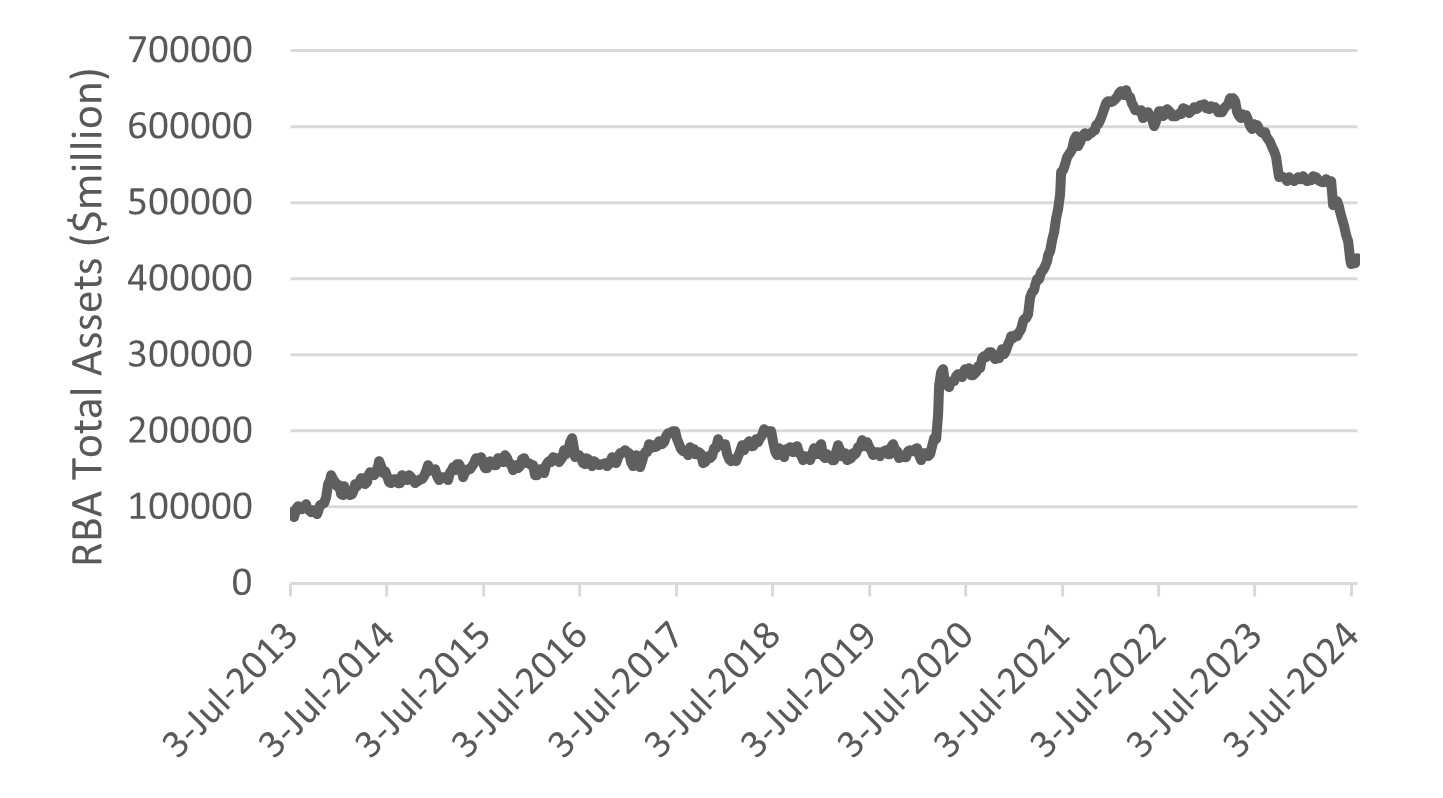
Notice that there has been some progress towards unwinding some of the assets the RBA accumulated during the pandemic. The RBA is gradually selling the government securities it purchased during 2020 and 2021. As they sell those securities, some of the money printed during the pandemic is soaked up. Compared to 2019, however, there is still a lot of extra cash out there. Money supply, measured by M3, jumped from about $2 trillion in 2019 to around $2.5 trillion by 2021. It is now around $3 trillion. We can see that efforts to reign in the cash that helped fuel inflation back in 2021 are ongoing. We can also see there is a long way to go. In the meantime, the distortions and hardships caused by inflation are being experienced by everyone. The problem, really, is that the financial markets and the housing markets got themselves addicted to the sugar flowing from the central banks. Weaning them off without causing a crash is a very difficult thing to do, remembering that while houses are many people’s biggest asset, mortgages are also many people’s biggest liability. A housing crash would certainly be welcomed by those looking to buy, but it would be a disaster for those who find themselves, say, with a mortgage of $850,000 and a house that’s suddenly valued at $600,000. In the meantime, though inflation might be down to around 4% from around 7%, prices continue to rise, just not as quickly as they did during 2022. They’re not going down.
Discussion Question
What is the future of ESG investing in Australia? Should the RBA take a more aggressive approach to unwinding the pandemic stimulus? Or is it afraid that doing so would cause the housing market to crash?